3D emission maps
Due to the highly anisotropic nature of bremsstrahlung and synchrotron radiation combined with the fact that radiation is only detected if it’s emitted directly at the detector, a given detector can only measure radiation from particles in a certain regions of space. It can be shown that these regions of space all satisfy (approximately) the condition
where \(\hat{\boldsymbol{b}}\) is the magnetic field unit vector, \(\boldsymbol{x}\) is the particle’s position, \(\boldsymbol{X}\) is the detector’s position and \(\theta_{\mathrm{p}}\) denotes the particle’s pitch angle (note that the pitch angle also varies as the particle moves in the inhomogeneous magnetic field, and therefore picks up a dependence on \(\boldsymbol{x}\)). The solution to this equation, i.e. the points \(\boldsymbol{x}\) satisfying it, trace out a surface in real space which we refer to as the surface-of-visibility. When the detector is located in the midplane, this surface typically takes the shape of a twisted cylinder.
Solving for surface-of-visibility
Using SOFT it is possible to solve (1), accounting for the finite
detector size. This is done by adding the sycout space3d (see
space3d for a parameter reference) to your SOFT
runscript. As with every sycout, you must also add a line product=space3d
to the tool sycamera block. One example definition of the sycout is a
follows
sycout space3d {
    output=outfile.mat
    type=pixels
    pixels=200
    point0=-0.5,-0.25,-0.25
    point1=0.5,0.25,0.25
}
The output parameter specifies the name of the output file, and the
type parameter specifies the algorithm to use for storing 3D information.
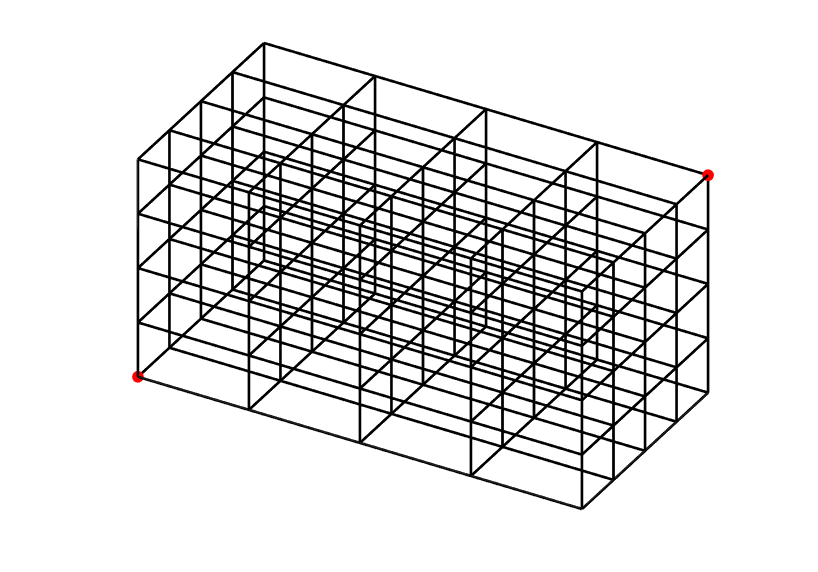
Setting type=pixels means SOFT will divide the space into \(N^3\)
cells, where \(N\) is the value assigned to the pixels parameter,
between the two edge points point0 and point1 (see the figure below;
the red dots indicate the locations of the edge points). During the SOFT run,
each cell records the radiation being emitted from the box and accumulates it.
The other value available for type is real, which stores the exact
coordinates of each point that contributes to the final image. This means that
the output will be more detailed, but it will also grow with each particle.
Visualizing
Visualization of space3d files is complicatd by the fact that each point represents emitted light, which adds together along lines of sights. A simple C program has been written by Mathias for generating sequences of PNG images from S3D output files. The program is available on GitHub: s3dvid.